When developing electrochemical sensors, researchers and engineers frequently face the challenge of navigating a complex interplay of chemical and electrochemical parameters. A significant portion of research time is often devoted to fine-tuning conditions to achieve the highest sensitivity and accuracy in detection. This is particularly true for heavy metal detection, where understanding complex redox behaviours and metal speciation across different environmental conditions is essential to optimise performance.
Pourbaix diagrams, with their ability to map the thermodynamic stability of species under varying conditions, offer a valuable tool to streamline this process and speed up sensor development.
What are Pourbaix Diagrams?
Pourbaix diagrams plot the electrochemical stability for different redox states of an element as a function of pH. They are similar to phase diagrams, which map out which state (solid, liquid, or gas) is thermodynamically most stable under specific conditions of temperature and pressure.
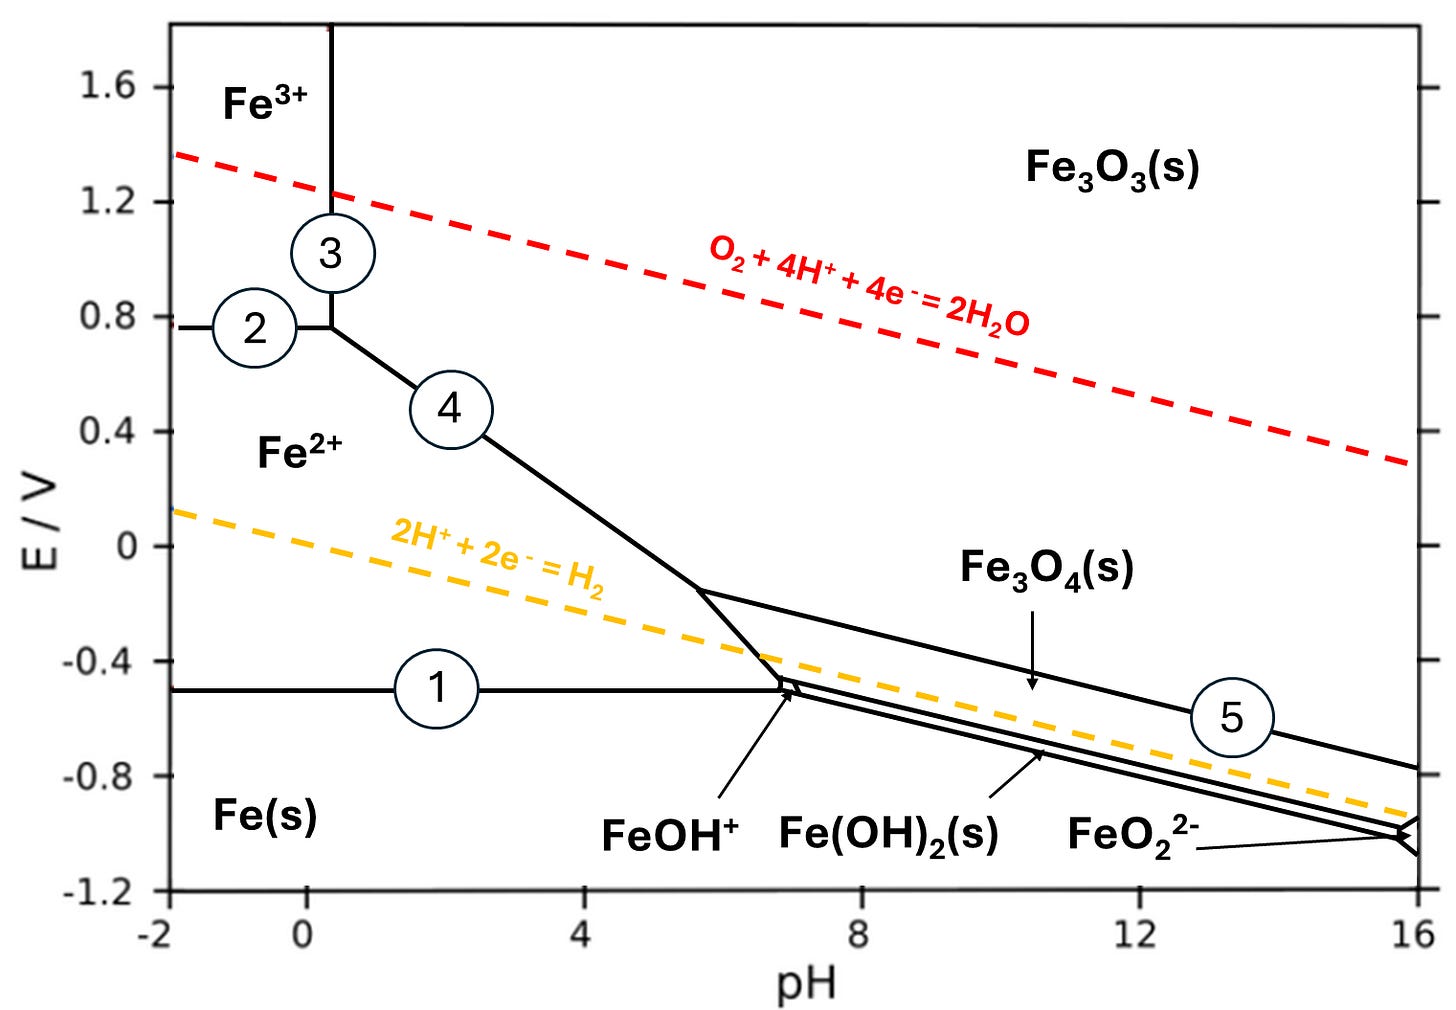
Example: Iron Pourbaix Diagram
Areas in the Pourbaix diagram mark the condition under which a single species (Fe2+) is stable. The species with the highest stability tend to take occupy the largest areas.
The Lines or area boundaries mark the conditions where two or more species exist in equilibrium.
Horizontal lines indicate reactions which are not dependent on pH (pure redox) while vertical lines do not depend on potential (pure acid-base). The other lines which have a negative slope are both acid-base and redox.
1. Fe2+ + 2e- ——> Fe(s) (pure redox reaction)
3. 2Fe3+ + 3H2O ——> Fe2O3(s) + 6H+ (Pure acid-base reaction)
4. 2Fe2+ + 3H2O ——> Fe2O3(s) + 6H+ + 2e- (both redox and acid-base)
In Pourbaix diagrams, water redox reactions are often represented by dotted lines to indicate the boundaries of water's stability. These lines define the region where liquid water is stable, lying between the potential limits set by water oxidation and reduction. Above the line representing oxygen evolution, water becomes unstable and is oxidised, following the reaction:
O2 + 4H+ + 4e- ——> 2H2O
Below the line representing hydrogen evolution, water is also unstable, and hydrogen ions are reduced:
2H+ + 2e- ——> H2
If you enjoy this content and would like to support it consider becoming a paid subscriber. For just £3.50/month get access to all Electrochemical Insights along with other benefits such as leaving comments, asking questions, and suggesting future content.


